

Turning orbit data into
operational insight
High-resolution Earth observation for strategic defense and national progress — processed, classified, and visualized.
Coming Soon
Analytics features in development
A preview of the detection, classification, and visualization capabilities being built into the Bharat Space imagery platform.
Change Detection
Quantify what moved on the ground
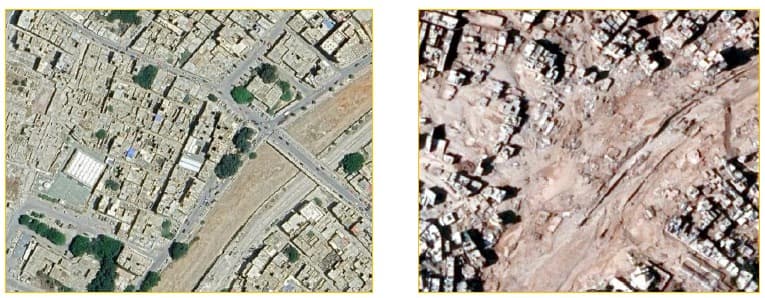
Description: A comparative analysis of satellite images captured at different time intervals, highlighting critical changes such as new constructions, infrastructure damage, land shifts, or deforestation.
Purpose: Demonstrates the platform's ability to automatically detect and quantify temporal changes — from urban expansion tracking and disaster response to military surveillance and strategic defense monitoring.
- ✓Clearly highlighted change zones — red for new objects, blue for removed areas
- ✓Timestamp overlays and change heatmap visualization
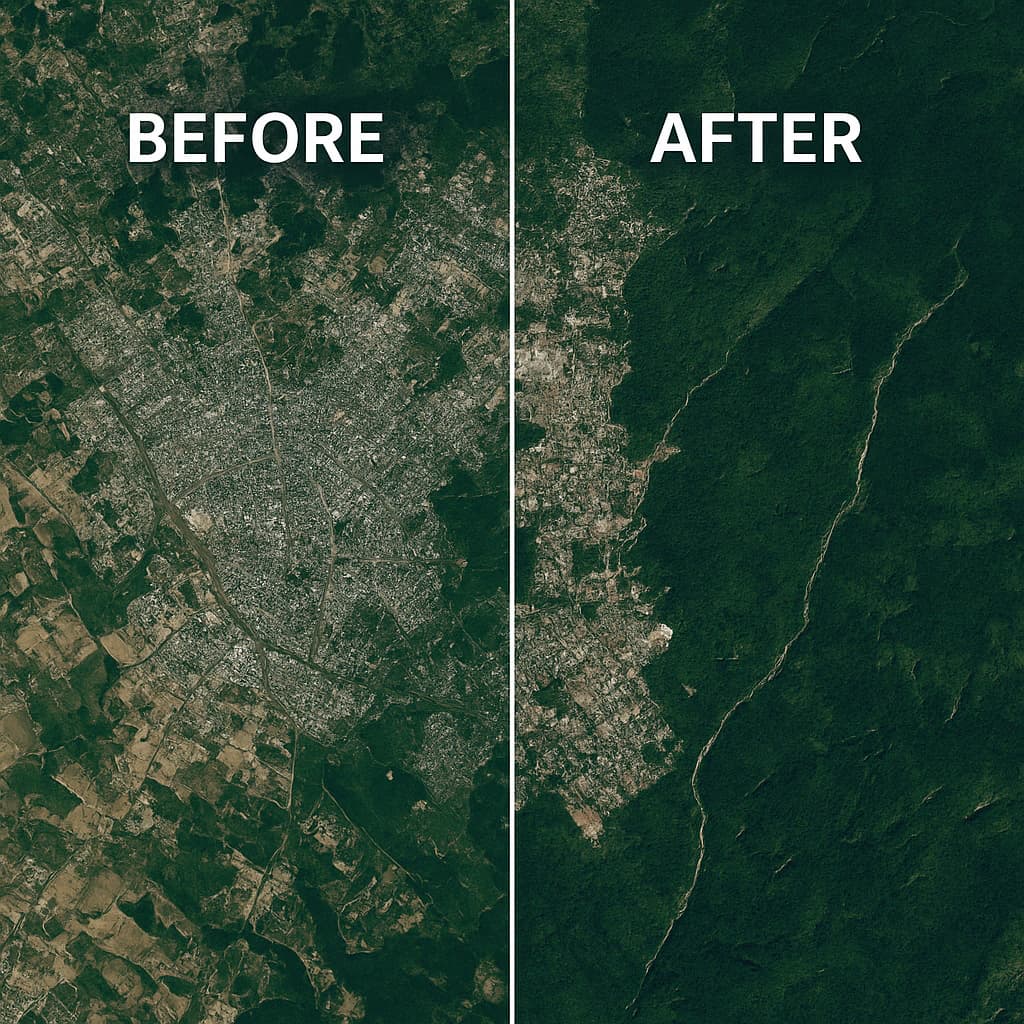
Temporal Image Comparison
See exactly what changed, and when
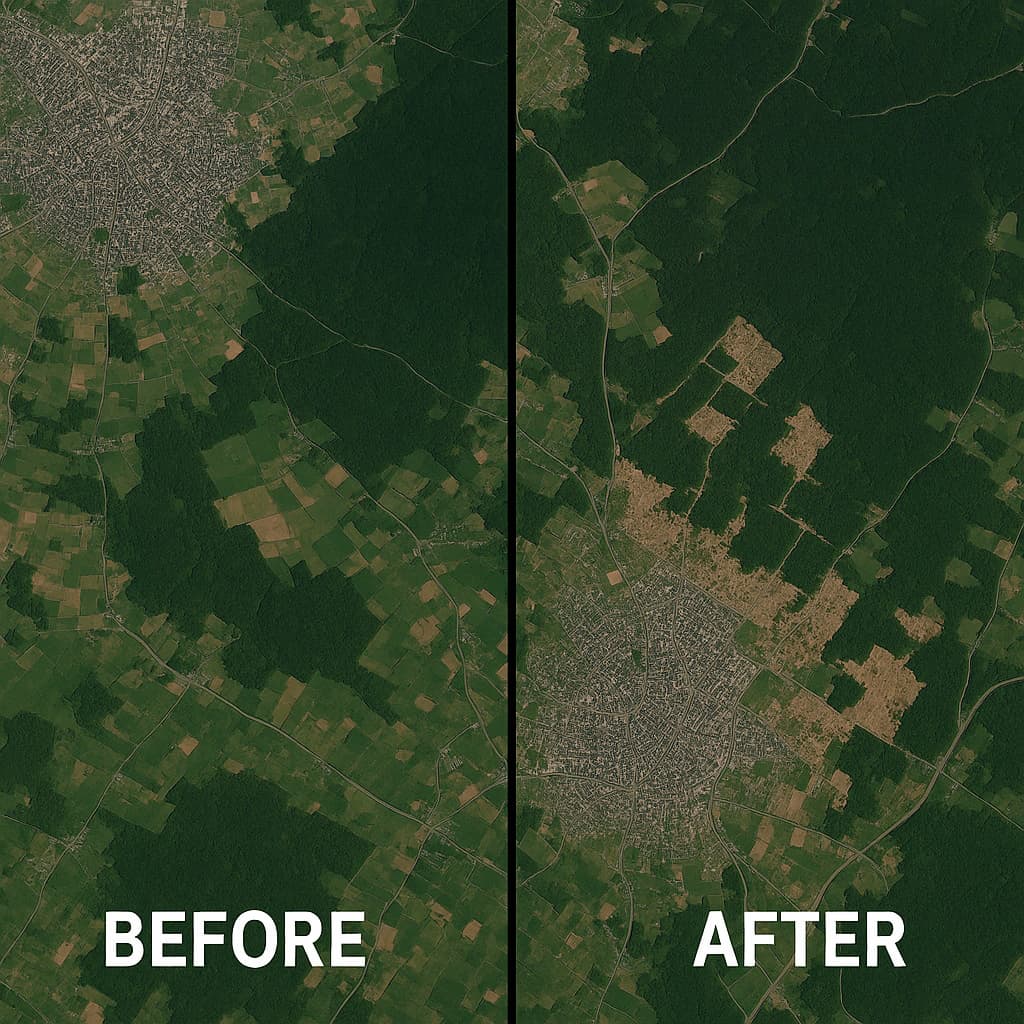
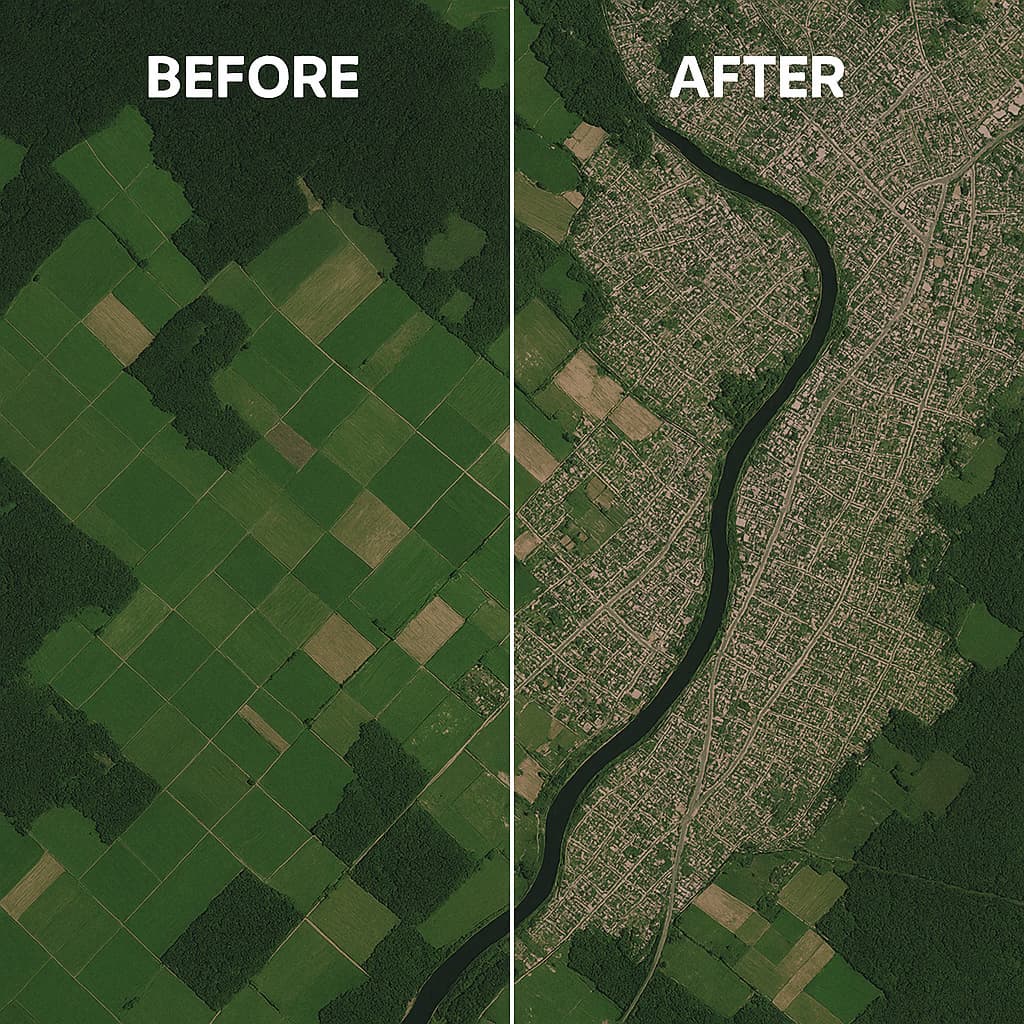
Description: A side-by-side comparison of two satellite images of the same area captured at different times, visually highlighting changes such as urban expansion or environmental shifts like deforestation.
Purpose: Demonstrates the platform's ability to analyze and display temporal changes in geospatial data — critical for tracking development or natural phenomena over time.
- ✓Two images labeled "Before" and "After," with differences like new buildings or altered landscapes clearly visible
Heatmap Visualization
Spot patterns and hotspots instantly
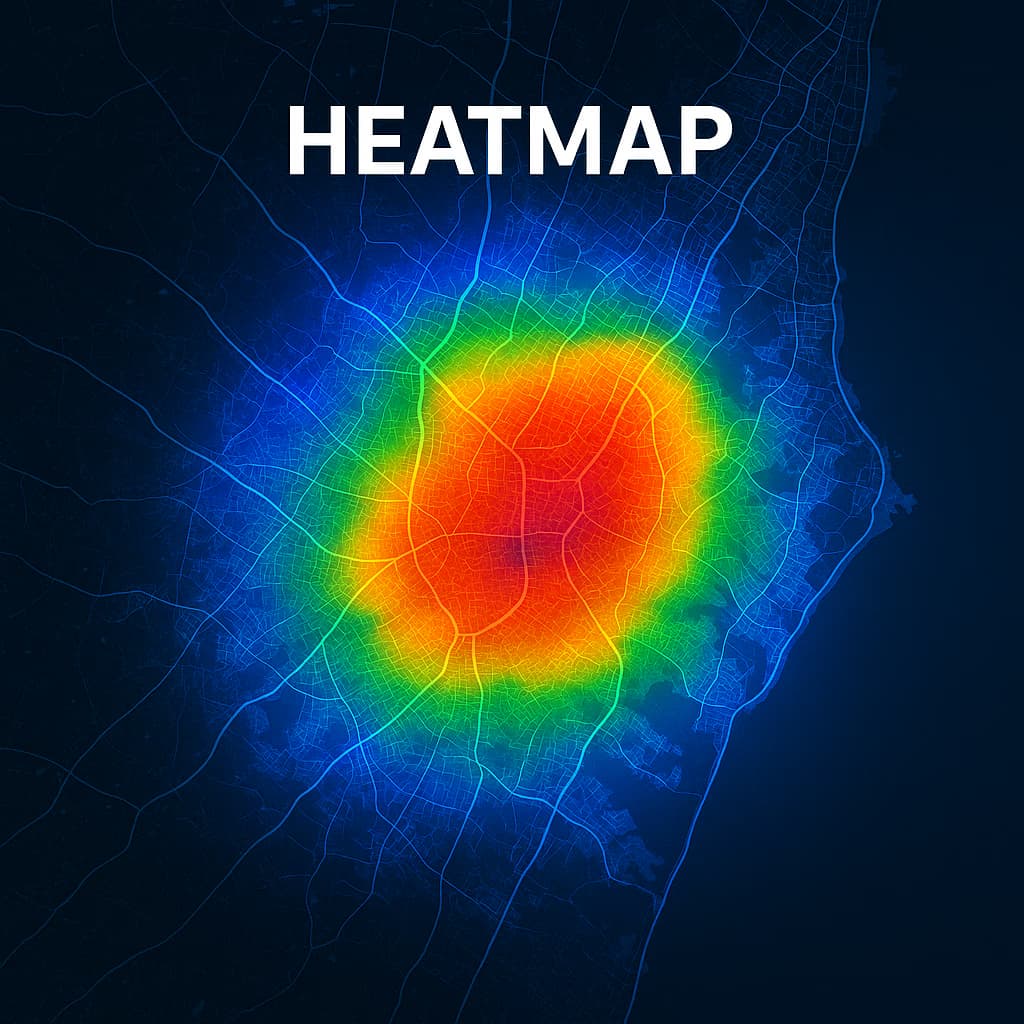
Description: A heatmap overlaid on a geographic map, using color gradients to represent data intensity — population density, pollution levels, or vegetation cover.
Purpose: Showcases the platform's capability to visualize complex geospatial data patterns intuitively, helping users identify trends or hotspots.
- ✓Vibrant color scale — red for high intensity, blue for low — applied to a recognizable region for context
Land Cover Classification
Every pixel, classified and labeled
Description: A processed satellite image where distinct land cover types — water, forest, and urban areas — are color-coded for easy differentiation.
Purpose: Illustrates the platform's ability to classify and analyze imagery data, enabling detailed insights into land use or environmental conditions.
- ✓A satellite view with color blocks — blue for water, green for forest, gray for urban — paired with a simple legend for clarity
Analytics Dashboard Mockup
Imagery metrics, structured for action
Description: A mockup of an analytics dashboard displaying metrics tied to imagery data, such as cloud cover percentages, image resolution stats, or sensor performance.
Purpose: Highlights the platform's analytical tools and how it presents actionable insights to users in a structured format.
- ✓A clean layout featuring graphs, pie charts, and data tables designed to reflect real-world analytics outputs
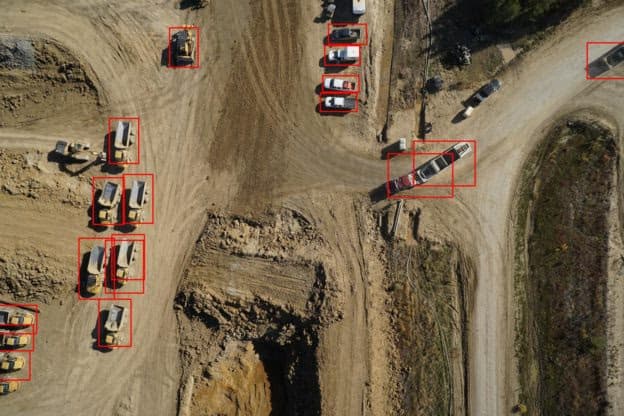
Object Detection
Find what matters, automatically
Description: Processed satellite imagery overlaid with bounding boxes that pinpoint objects of interest such as aircraft, vehicles, ships, or infrastructure.
Purpose: Showcases the system's capability to automatically detect and classify strategic objects in satellite images — ideal for defense monitoring, logistics tracking, or critical infrastructure protection.
- ✓High-resolution satellite view with color-coded bounding boxes, labels and confidence scores
- ✓A compact legend (e.g. red = Aircraft, yellow = Truck)